WaveThresh
Help
HaarMA
Generate Haar MA processes.
DESCRIPTION
This function generates an arbitrary number of observations from
a Haar MA process of any order with a particular variance.
USAGE
HaarMA(n, sd=1, order=5)
REQUIRED ARGUMENTS
- n
- The number of observations in the realization that you want to create.
Note that n does NOT have to be a power of two.
OPTIONAL ARGUMENTS
- sd
- The standard deviation of the innovations.
- order
-
The order of the Haar MA process.
VALUE
A vector containing a realization of
a Haar MA process of the specified order, standard deviation and
number of observations.
SIDE EFFECTS
None
DETAILS
A Haar MA process is a special kind of time series moving-average (MA)
process. A Haar MA process of order k is a MA process of order 2^k.
The coefficients of the Haar MA process are given by the filter coefficients
of the discrete Haar wavelet at different scales.
For example: the Haar MA process of order 1 is an MA process of order 2.
The coefficients are 1/sqrt(2) and -1/sqrt(2). The Haar MA process of
order 2 is an MA process of order 4. The coefficients are
1/2, 1/2, -1/2, -1/2 and so on. It is possible to define other processes
for other wavelets as well.
Any Haar MA process is a good example of a (stationary) LSW process
because it is sparsely representable by the locally-stationary wavelet
machinery defined in Nason, von Sachs and Kroisandt.
RELEASE
Version 3.9 Copyright Guy Nason 1998
REFERENCES
Nason, G.P., von Sachs, R. and Kroisandt, G. (1998).
Wavelet processes and adaptive estimation of the evolutionary wavelet
spectrum. Technical Report, Department of Mathematics University of
Bristol/ Fachbereich Mathematik, Kaiserslautern.
SEE ALSO
HaarConcat,
ewspec,
EXAMPLES
#
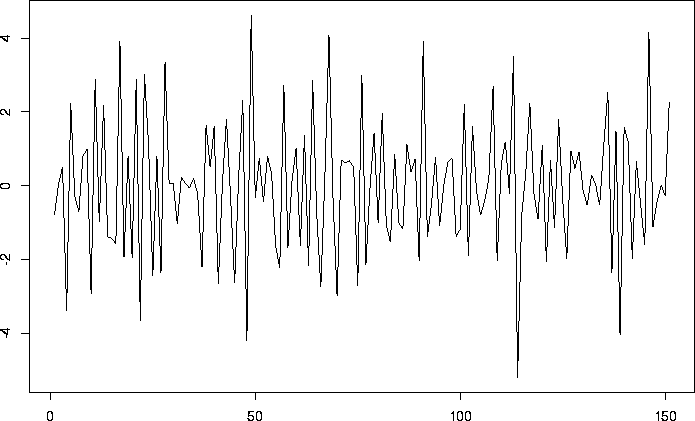
# Generate a Haar MA process of order 1 (high frequency series)
#
> MyHaarMA <- HaarMA(n=151, sd=2, order=1)
#
# Plot it
#
> tsplot(MyHaarMA)
 #
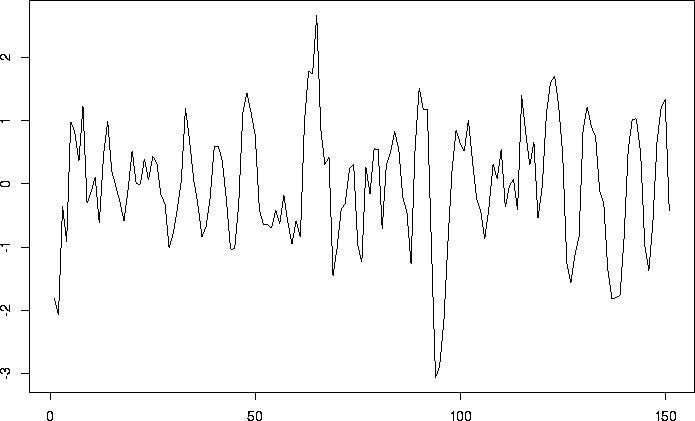
# Generate another Haar MA process of order 3 (lower frequency), but of
# smaller variance
#
> MyHaarMA2 <- HaarMA(n=151, sd=1, order=3)
#
# Plot it
#
> tsplot(MyHaarMA2)
#
# Generate another Haar MA process of order 3 (lower frequency), but of
# smaller variance
#
> MyHaarMA2 <- HaarMA(n=151, sd=1, order=3)
#
# Plot it
#
> tsplot(MyHaarMA2)
 #
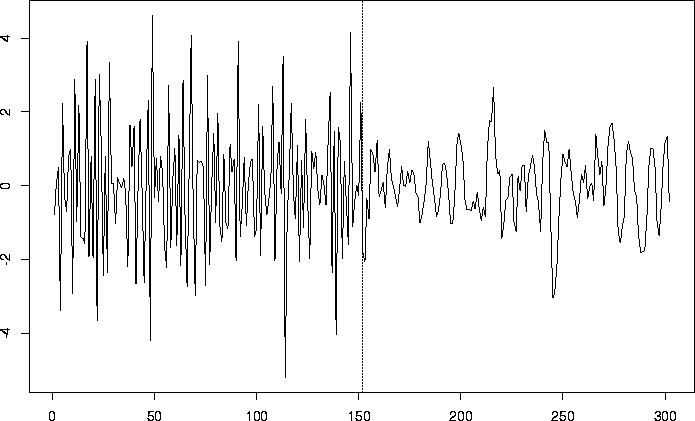
# Let's plot them next to each other so that you can really see the
# differences.
#
# Plot a vertical dotted line which indicates where the processes are
# joined
#
> tsplot(c(MyHaarMA, MyHaarMA2))
> abline(v=152, lty=2)
#
# Let's plot them next to each other so that you can really see the
# differences.
#
# Plot a vertical dotted line which indicates where the processes are
# joined
#
> tsplot(c(MyHaarMA, MyHaarMA2))
> abline(v=152, lty=2)

 #
# Generate another Haar MA process of order 3 (lower frequency), but of
# smaller variance
#
> MyHaarMA2 <- HaarMA(n=151, sd=1, order=3)
#
# Plot it
#
> tsplot(MyHaarMA2)
#
# Generate another Haar MA process of order 3 (lower frequency), but of
# smaller variance
#
> MyHaarMA2 <- HaarMA(n=151, sd=1, order=3)
#
# Plot it
#
> tsplot(MyHaarMA2)
 #
# Let's plot them next to each other so that you can really see the
# differences.
#
# Plot a vertical dotted line which indicates where the processes are
# joined
#
> tsplot(c(MyHaarMA, MyHaarMA2))
> abline(v=152, lty=2)
#
# Let's plot them next to each other so that you can really see the
# differences.
#
# Plot a vertical dotted line which indicates where the processes are
# joined
#
> tsplot(c(MyHaarMA, MyHaarMA2))
> abline(v=152, lty=2)
