 # Now use a smoother wavelet
datahr <- denproj(data, J=8, filter.number=10, family="DaubLeAsymm")
data.wd <- denwd(datahr)
plotdenwd(data.wd, top.level=(datahr$res$J-1))
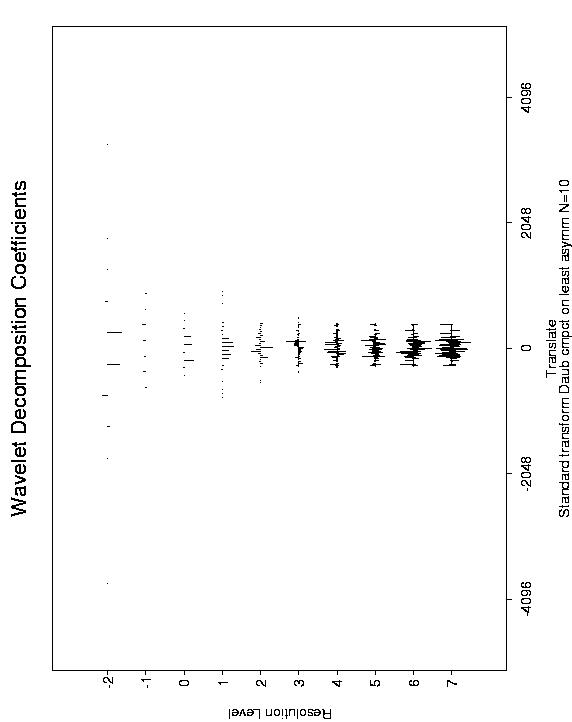
# Now use a smoother wavelet
datahr <- denproj(data, J=8, filter.number=10, family="DaubLeAsymm")
data.wd <- denwd(datahr)
plotdenwd(data.wd, top.level=(datahr$res$J-1))
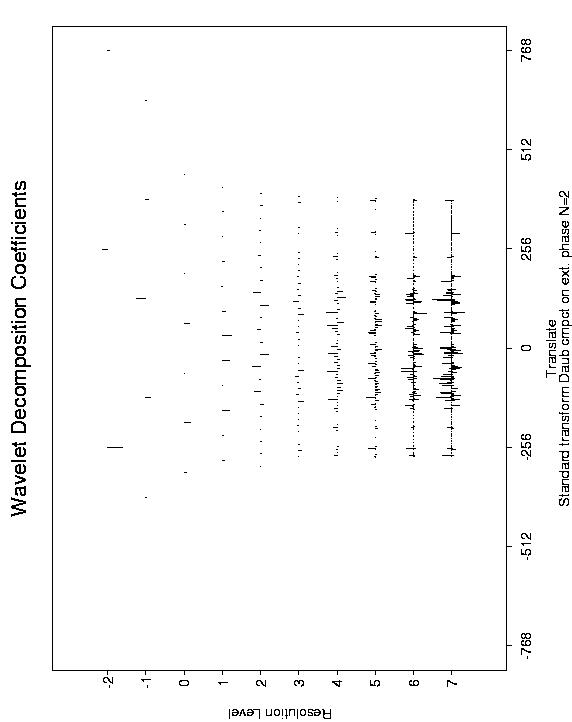
Axis labels to the right of the picture (scale factors). These are returned as they are sometimes hard to read on the plot.
Basically the same as plot.wd except that it copes with the zero boundary conditions used in density estimation. Note that for large filter number wavelets the high level coefficients will appear very squashed compared with the low level coefficients. This is a consequence of the zero boundary conditions and the use of the convention that each coefficient is plotted midway between two coefficients at the next highest level, as in plot.wd.
# Simulate data from the claw density, find the empirical # scaling function coefficients, decompose them and plot # the resulting wavelet coefficients data <- rclaw(100) datahr <- denproj(data, J=8, filter.number=2, family="DaubExPhase") data.wd <- denwd(datahr) plotdenwd(data.wd, top.level=(datahr$res$J-1))