WaveThresh
Help
threshold.imwd
Threshold two-dimensional wavelet decomposition object
DESCRIPTION
This function provides various ways to threshold a
imwd class object.
USAGE
threshold.imwd(imwd, levels = 3:(imwd$nlevels - 1), type = "hard", policy =
        "universal", by.level = F, value = 0, dev = var, verbose = F,
        return.threshold = F, compression = T, Q = 0.05)
REQUIRED ARGUMENTS
- imwd
- The two-dimensional wavelet decomposition object that you wish to
threshold.
OPTIONAL ARGUMENTS
- levels
- a vector of integers which determines which scale levels are thresholded
in the decomposition. Each integer in the vector must refer to a valid
level in the imwd object supplied. This is usually
any integer from 0 to
nlevels(wd)-1 inclusive.
Only the levels in this vector contribute to the computation of the
threshold and its application. (except for the fdr
policy).
- type
- determines the type of thresholding this can be
"hard"
or "soft".
- policy
- selects the technique by which the threshold value is selected. Each
policy corresponds to a method in the literature. At present the
different policies are:
"universal",
"manual",
"fdr",
"probability".
The policies are described in detail below.
- by.level
- If FALSE then a global threshold is computed on and applied to all
scale levels defined in
levels. If TRUE a threshold
is computed and applied separately to each scale level.
- value
- This argument conveys the user supplied threshold. If the
policy="manual"
then value is the actual
threshold value;
if
policy="probability"
then value conveys
the the user supplied quantile level.
- dev
- this argument supplies the function to be used to compute the
spread of the absolute values coefficients. The function supplied must
return a value of spread on the variance scale (i.e. not standard deviation)
such as the
var() function. A popular, useful and
robust alternative is the madmad function.
- verbose
- if TRUE then the function prints out informative messages as it progresses.
- return.threshold
- If this option is TRUE then the actual value of the threshold
is returned. If this option is FALSE then a thresholded version of the
input is returned.
- compression
- If this option is TRUE then this function returns a comressed
two-dimensional wavelet transform object of class
imwdc. This can be useful as the resulting object
will be smaller than if it was not compressed. The compression makes use
of the fact that many coefficients in a thresholded object will be
exactly zero.
If this option is FALSE
then a larger imwd object will be returned.
- Q
- Parameter for the false discovery rate
"fdr" policy.
VALUE
An object of class imwdc if
the compression option above is TRUE, otherwise a
imwd object is returned. In either case the
returned object contains the thresholded coefficients.
Note that if the
return.threshold option is set to TRUE then the threshold
values will be returned rather than the thresholded object.
SIDE EFFECTS
None
DETAILS
This function thresholds or shrinks wavelet coefficients stored in
a imwd object and by default returns the coefficients
in a modified imwdc object.
See the seminal papers by
Donoho and Johnstone for
explanations about thresholding.
For a gentle introduction to wavelet thresholding (or shrinkage
as it is sometimes called) see
Nason and Silverman, 1994.
For more details on each technique
see the descriptions of each method below
The basic idea of thresholding is very simple. In a signal plus noise
model the wavelet transform of an image is very sparse, the wavelet
transform of noise is not (in particular, if the noise is iid Gaussian
then so if the noise contained in the wavelet coefficients). Thus since
the image gets concentrated in few wavelet coefficients and the noise
remains "spread" out it is "easy" to separate the signal from noise
by keeping large coefficients (which correspond to true image) and
delete the small ones (which correspond to noise). However, one has
to have some idea of the noise level (computed using the dev
option in threshold functions). If the noise level is very large then
it is possible, as usual, that no image coefficients "stick up" above the noise.
There are many components to a successful thresholding procedure. Some
components have a larger effect than others but the effect is not the
same in all practical data situations. Here we give some rough
practical guidance, although you must refer to the papers below
when using a particular technique. You cannot expect to
get excellent performance on all signals unless you fully understand
the rationale and limitations of each method below. I am
not in favour of the "black-box" approach. The thresholding functions
of WaveThresh3 are not a black box: experience and judgement are required!
Some issues to watch for:
- levels
- The default of
levels = 3:(wd$nlevels - 1) for the
levels option most certainly does not work globally for
all data problems and situations. The level at which thresholding begins
(i.e. the given threshold and finer scale wavelets) is called the
primary resolution and is unique to a particular problem.
In some ways choice of the primary resolution is very similar to choosing
the bandwidth in kernel regression albeit on a logarithmic scale.
See Hall and Patil, (1995) and
Hall and Nason (1997) for more information.
For each data problem you need to work out which is the best
primary resolution. This can be done by gaining experience at what works
best, or using prior knowledge. It is possible to "automatically" choose
a "best" primary resolution using cross-validation (but not in WaveThresh).
Secondly the levels argument computes and applies the threshold at the
levels specified in the levels argument. It does this for
all the levels specified. Sometimes, in wavelet shrinkage, the threshold
is computed using only the finest scale coefficients (or more precisely
the estimate of the overall noise level). If you want your threshold
variance estimate only to use the finest scale coefficients (e.g.
with universal thresholding) then you will have to apply the
threshold.imwd function twice. Once (with levels set equal to
nlevels(wd)-1 and with
return.threshold=TRUE to return the threshold computed on
the finest scale and then apply the threshold function with the
manual option supplying the value of the previously computed
threshold as the value options.
Note that the fdr policy does its own thing.
- by.level
- for a wd object which has come from data with
noise that is correlated then you should have a threshold computed for
each resolution level. See the paper by
Johnstone and Silverman, 1997.
This section gives a brief description of the different thresholding
policies available. For further details see the associated papers.
If there is no paper available then a small description is provided here.
More than one policy may be good for problem, so experiment! They
are arranged here in alphabetical order:
- fdr
- See Abramovich and Benjamini, 1996.
Contributed by Felix Abramovich.
- manual
- specify a user supplied threshold using
value to pass the
value of the threshold. The value argument should be a vector.
If it is of length 1 then it is replicated to be the same length as the
levels vector, otherwise it is repeated as many times as is
necessary to be the levels vector's length. In this way,
different thresholds can be supplied for different levels. Note that the
by.level option has no effect with this policy.
- probability
- The
probability policy works as follows. All coefficients that
are smaller than the valueth quantile of the coefficients are
set to zero. If by.level is false, then the quantile is computed
for all coefficients in the levels specified by the "levels" vector;
if by.level
is true, then each level's quantile is estimated separately.
The probability policy is pretty stupid - do not use it.
- universal
- See Donoho and Johnstone, 1995.
Acknowledgement
The FDR code segments were kindly donated by
Felix Abramovich.
RELEASE
Version 3.6 Copyright Guy Nason and others 1997
SEE ALSO
imwd,
imwd object,
imwdc object.
lt.to.name.
threshold.
EXAMPLES
#
# Let's use the lennon test image. Lennon has 256x256 pixels with the
# range of pixel values being 0 to 249.
#
image(lennon)
#  #
# Now let's do the 2D discrete wavelet transform with the default arguments.
#
lwd <- imwd(lennon)
#
# Let's look at the coefficients
#
plot(lwd)
#
# Now let's do the 2D discrete wavelet transform with the default arguments.
#
lwd <- imwd(lennon)
#
# Let's look at the coefficients
#
plot(lwd)
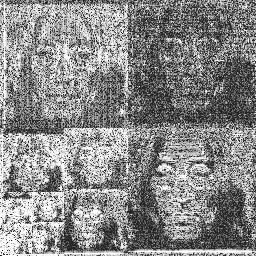 #
# Let's explain the plot. The plot consists of a number of subimages.
# Each subimage corresponds to wavelet coefficients at different scales
# and different orientations. See the help for imwd
# but here is a brief description. Each scale contains three orientations:
# horizontal, vertical and diagonal. The plot contains all the scales and
# all the orientations. The three large subimages at the top left, top right
# and bottom right are the finest scale detail in the vertical, diagonal and
# horizontal directions. The next largest three subimages tucked under the
# previous mentioned are the same orientations but at the next coarser scale.
# As one moves to the bottom left of the whole image the scale of the images
# gets coarser and coarser. For 256^2 pixels there are log_2(256)=8 scales
# of subimages although it is harded to see some of the smaller, coarser
# scales.
#
# You can get to see coarser scales by extracting the coefficients out
# using the lt.to.name function.
#
#
# Now let's threshold the coefficients
#
lwdT <- threshold(lwd)
#
# And let's plot those the thresholded coefficients
#
plot(lwdT)
#
# Let's explain the plot. The plot consists of a number of subimages.
# Each subimage corresponds to wavelet coefficients at different scales
# and different orientations. See the help for imwd
# but here is a brief description. Each scale contains three orientations:
# horizontal, vertical and diagonal. The plot contains all the scales and
# all the orientations. The three large subimages at the top left, top right
# and bottom right are the finest scale detail in the vertical, diagonal and
# horizontal directions. The next largest three subimages tucked under the
# previous mentioned are the same orientations but at the next coarser scale.
# As one moves to the bottom left of the whole image the scale of the images
# gets coarser and coarser. For 256^2 pixels there are log_2(256)=8 scales
# of subimages although it is harded to see some of the smaller, coarser
# scales.
#
# You can get to see coarser scales by extracting the coefficients out
# using the lt.to.name function.
#
#
# Now let's threshold the coefficients
#
lwdT <- threshold(lwd)
#
# And let's plot those the thresholded coefficients
#
plot(lwdT)
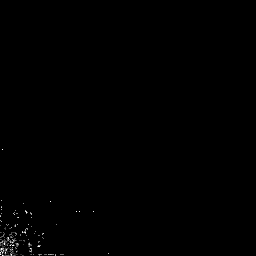 #
# Note that the only remaining coefficients are down in the bottom
# left hand corner of the plot. All the others (black) have been set
# to zero (i.e. thresholded).
#
# Note that the only remaining coefficients are down in the bottom
# left hand corner of the plot. All the others (black) have been set
# to zero (i.e. thresholded).