About ChromoPainter
ChromoPainter is a tool for finding haplotypes in sequence data. Each individual is "painted" as a combination of all other sequences. It can output a range of features, including:- Sample haplotypes
- Expectations of the number of recombination events at all sites
- A wide range of related features
Download ChromoPainter
How it works
This is a rough explanation of why our method works, and also why it is efficient.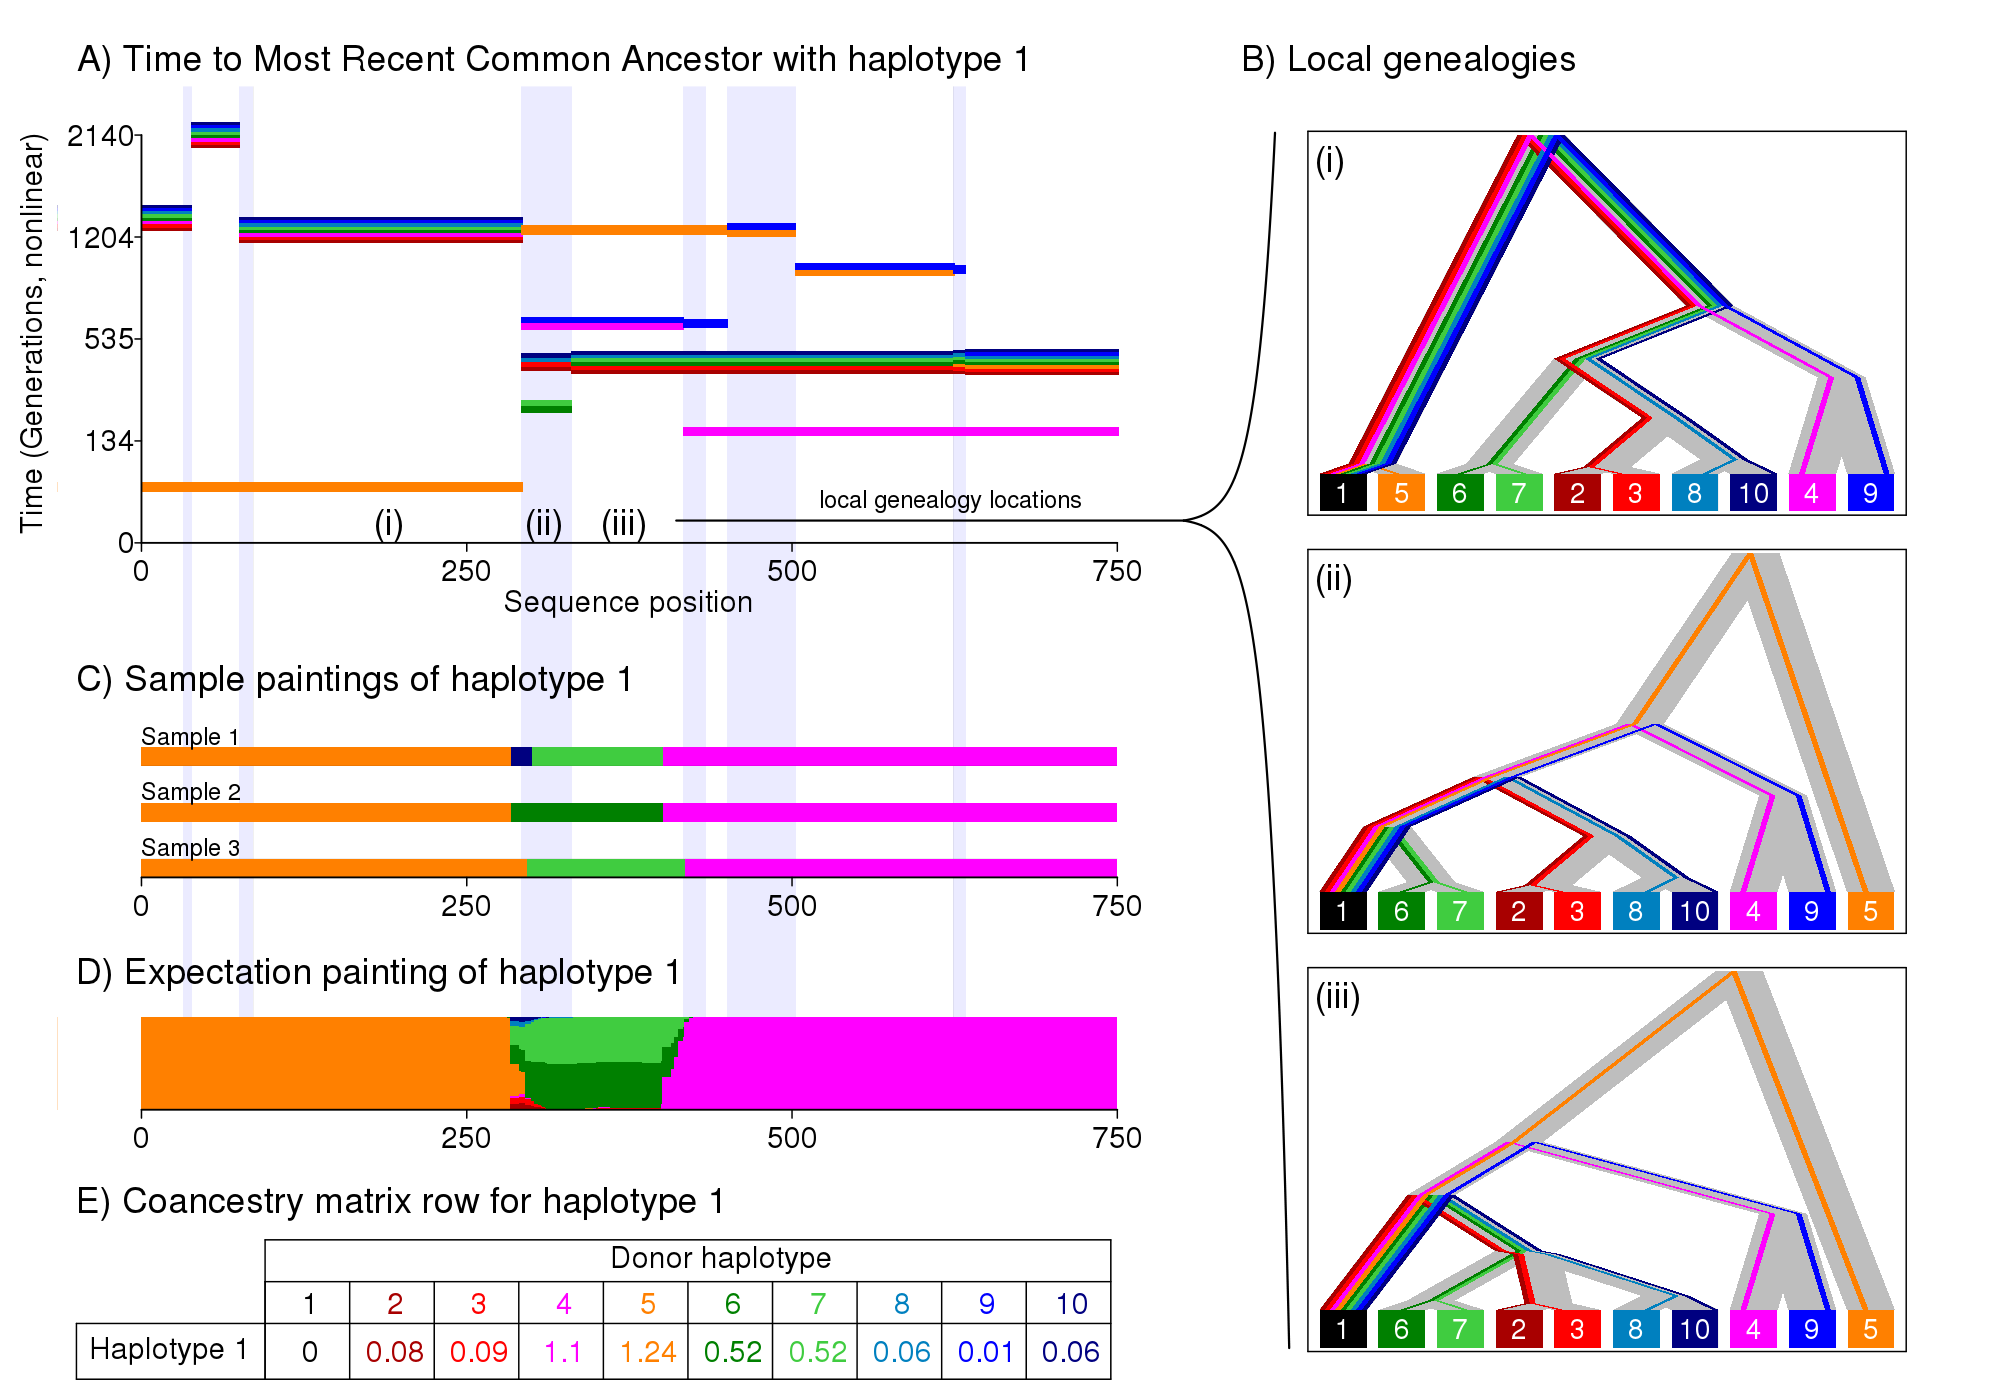
This figure shows how we paint chromosomes, and why this is a sensible thing to do. Imagine data generated from an Ancestral Recombination Graph, i.e. a large family tree showing all the connections for all ancestors - it is a graph not a tree because your distinct relatives will all share the same distant ancestors when we go far enough back in time. For illustration purposes we work with haplotypes, which can be roughly thought of as individuals. For any given gene, there is a tree relationship between the haplotypes (i.e. figure b). But considering the tree from haplotype 1's perspective (the black one), all that matters is the most recent common ancestor with each other haplotype. This is what is shown in Figure a). The time to the most recent common ancestor changes along the genome due to recombination, resulting in different trees for different genes (c.f. figure b i-iii). Knowing figure a) for all haplotypes would be the same as knowing the full Ancestral Recombination Graph (excluding unidentifiable recombination).
Genetic data is informative about the order recent ancestry but gets less informative as we go back in time. The "closest haplotype" is one of the strongest signals in the data. This is what the Li & Stephens "Painting" algorithm (and ChromoPainter) looks for, shown in Figure c. We search contiguous blocks that match haplotype 1, in this example the orange, green then pink haplotypes. This approach ignores a lot of the (irrelevant) complexity of the graph - recombination that doesn't change the closest type can be ignored. This helps increase statistical power. But there is uncertainty, e.g. in Figure b) (ii) when multiple haplotypes are equally close. Figure d) shows how we account for uncertainty, by considering the expected number of chunks that are copied (which can be cheaply computed in this case). Figure e) gives the "coancestry matrix" that we use for inference in fineSTRUCTURE.
In this example, the blues and greens are a different population to the reds and oranges. Since the genomic tract is very short we have few effectively independent chunks, so just forming populations based on this data would be naive. fineSTRUCTURE can identify the clusters that differ, and assess the statistical significance of the differences between them.
A more complex example can be seen in the following figure, which has the same meaning as the previous for a more complicated example.
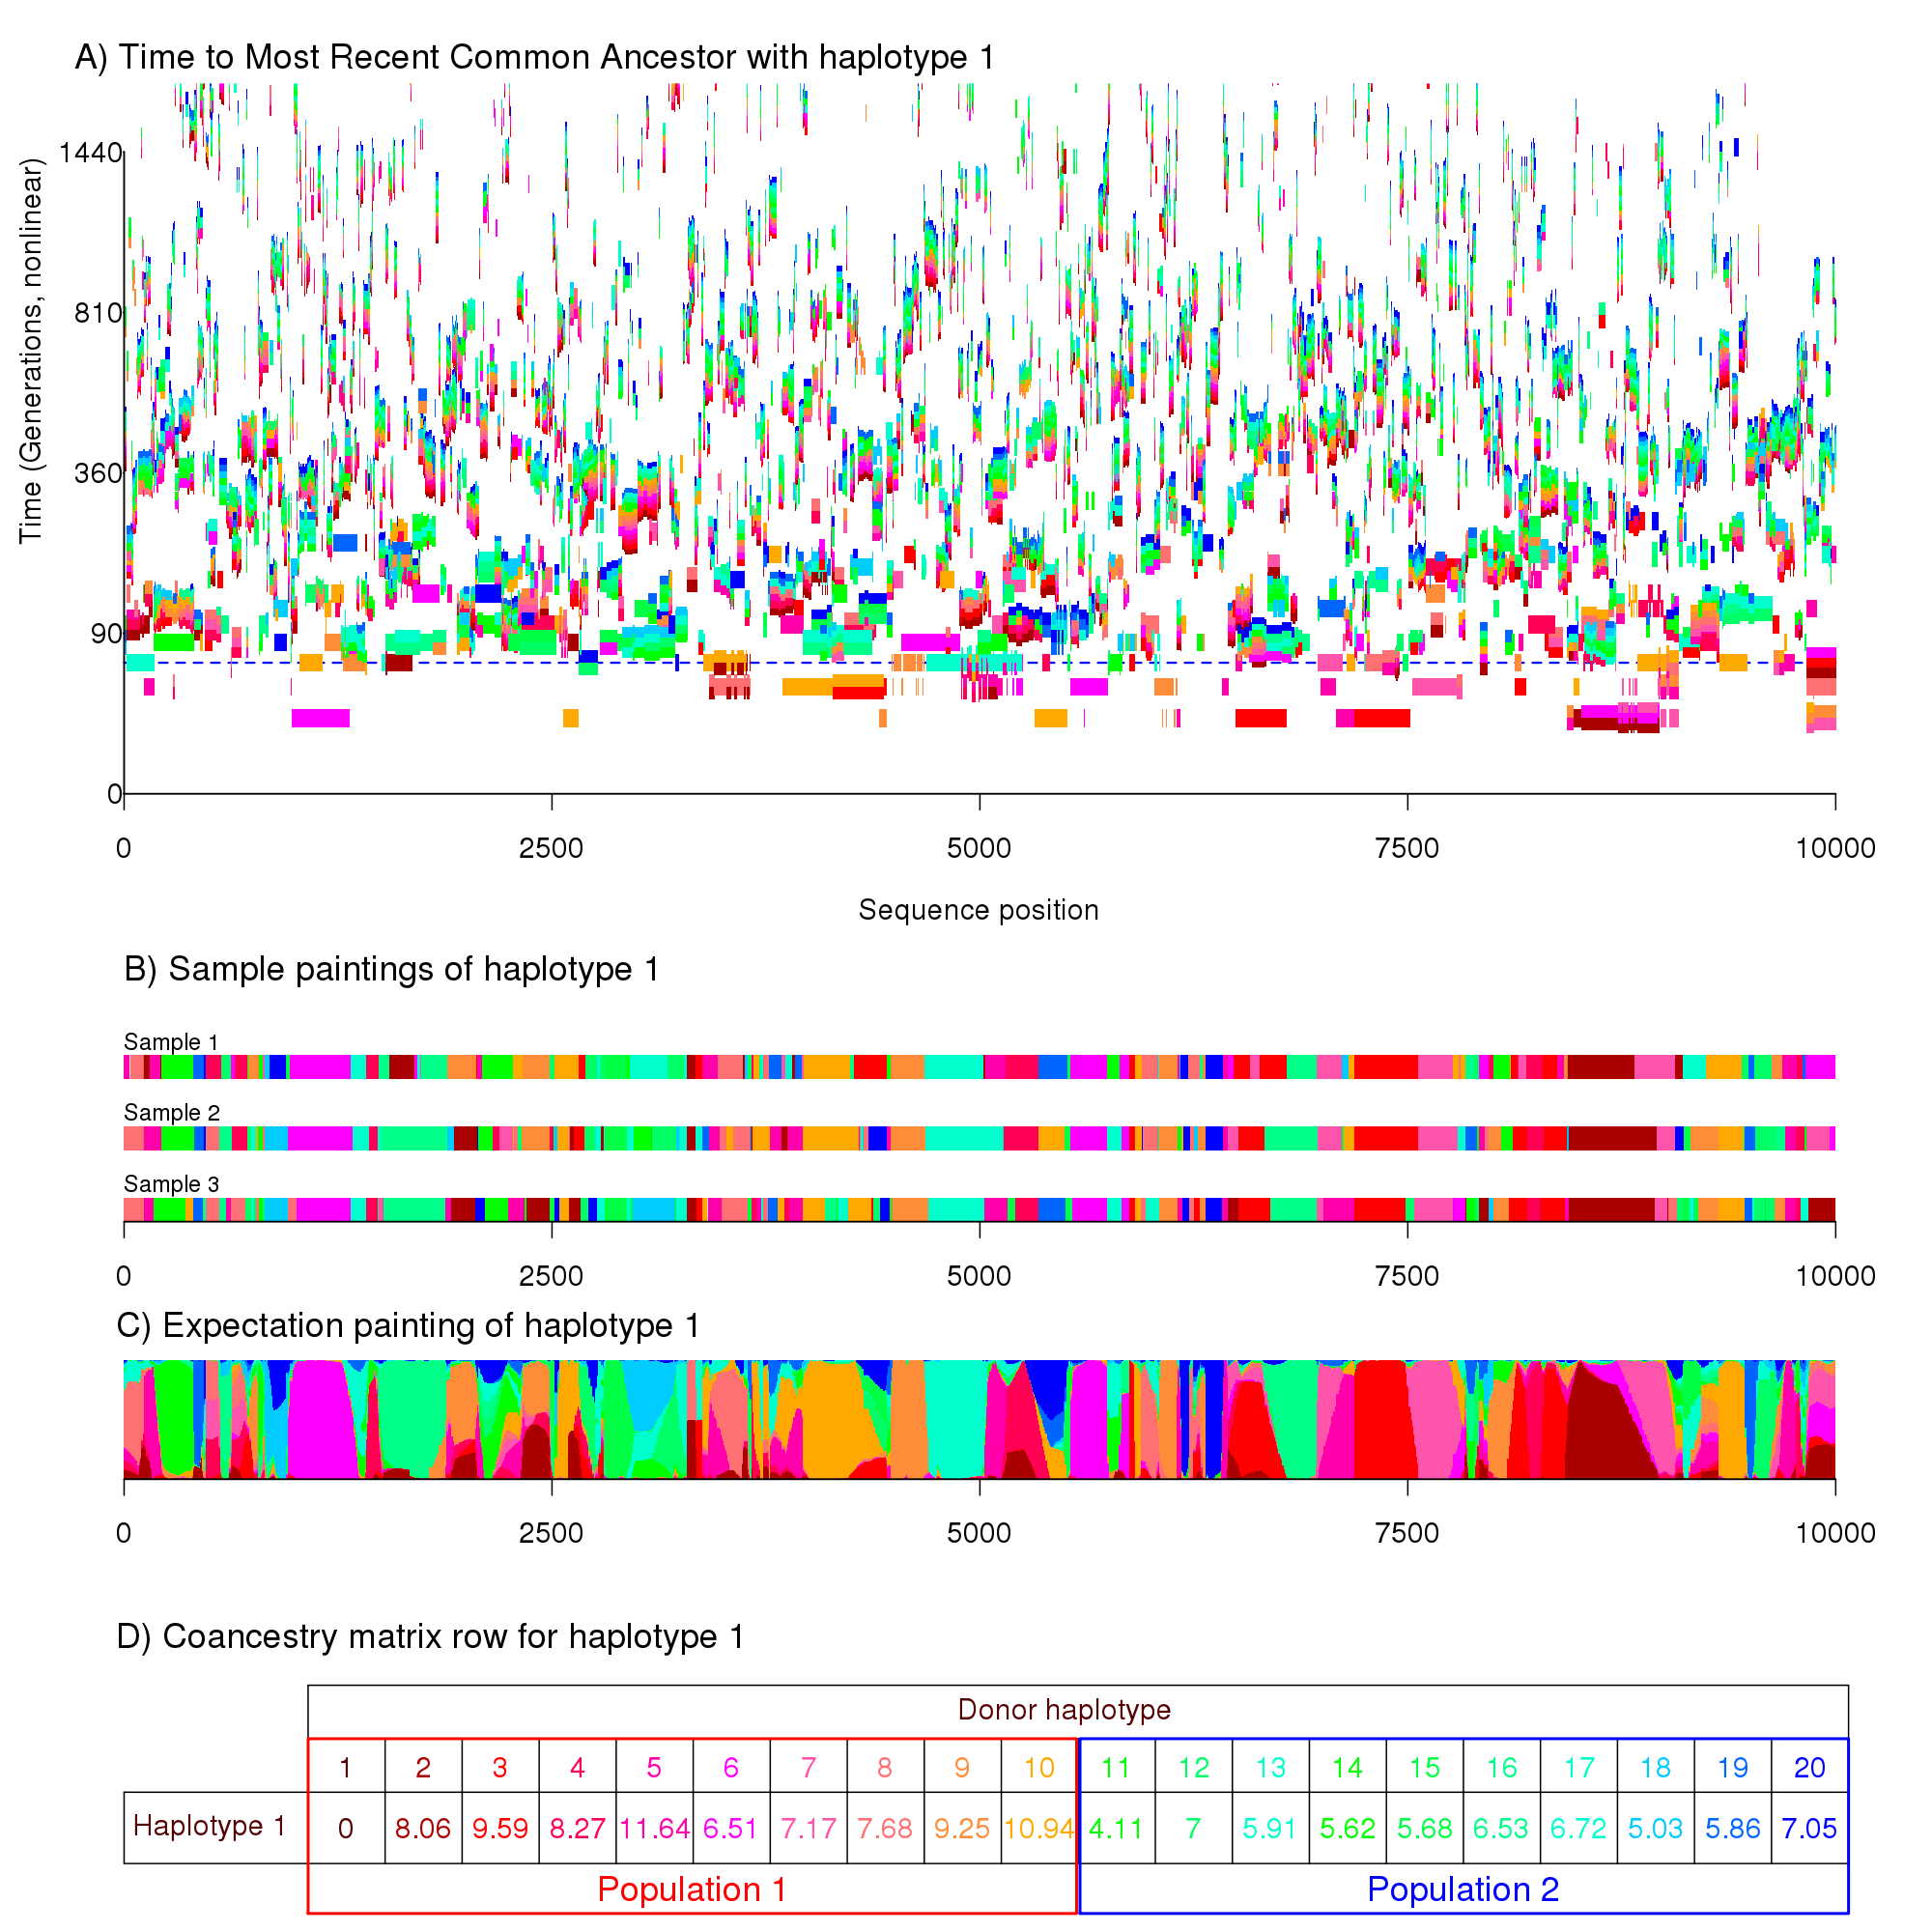
This figure is for a much longer genomic region and has 20 haplotypes split into two different populations. The population model is forbids very close relationships forming between the two populations, separating the "red" population from the "blue" at the horizontal dashed line. Close examination will show that there are fewer blue chunks and that they are shorter on average. The end result is that fewer chunks are copied between populations than within, a feature that we can exploit in fineSTRUCTURE.
There are significant efficiency savings made in this process. We can compute the expected number of chunks analytically using standard tools of the "Hidden Markov Model" behind the painting algorithm. We can similarly account for parameter uncertainty in the fineSTRUCTURE phase, integrating out the uncertain parameters associated with each population.
ChromoCombine
For simple problems, the output of ChromoPainter can be used directly in e.g. fineSTRUCTURE. However, for larger problems it is best to split up the data and run ChromoPainter separately for different genomic regions and different individuals. Therefore ChromoPainter can produce a lot of related files on a lot of machines. To help you combine them correctly, we have created a tool called ChromoCombine. In essence, all you have to do is place all the files into a single folder and tell ChromoCombine about it. Combining is a simple matter of summing the chunk counts (and other quantities) across regions, after which the effective number of chunks (i.e. the fineSTRUCTURE c factor) needs to be recalculated. All of this is done by the program; users shouldn't have to worry about it.Download ChromoCombine
Citation and further information
The correct citation is:- Lawson, Hellenthal, Myers, and Falush (2012), "Inference of population structure using dense haplotype data", PLoS Genetics, 8 (e1002453). (preprint and Supporting Information in a single PDF file rather than many individual files).