Frequently Asked Questions
If your question isn't answered here, try the
finestructure-discuss@jiscmail.ac.uk mailing list,
or email
Daniel Lawson.
General questions
- Do I need to use ChromoCombine even though I don't have multiple input files? What are the stages of processing? You always need to use ChromoCombine, as it calculates the variance expected in the data which is used by fineSTRUCTURE. The pipeline for every analysis is:
ChromoPainter-> ChromoCombine->fineSTRUCTURE MCMC->fineSTRUCTURE tree creation.
- Do I need a linkage map? No. You can assume uniform recombination rates and obtain significantly better results than ignoring linkage.
- Are phasing problems likely to cause bad population assignments? We don't think so. It should be the case the a poorly phased linkage analysis is still better than an unlinked analysis. Certainly, using current phasing algorithms this has always been true in practice.
- Can I combine data from different chromosomes into the same run?
Yes. You can simply merge the different chromosomes into a single file, and
then specify a negative recombination distance between them, which
will be treated as infinity. This is probabily easiest to acheive with some
tool like PLINK, for
which you might want the conversion tools.
Note that PLINK has a disclaimer about handling phased data, but it does
work in practice for simple operations. You will be able to detect
phase loss errors by the resulting loss of haplotypes.
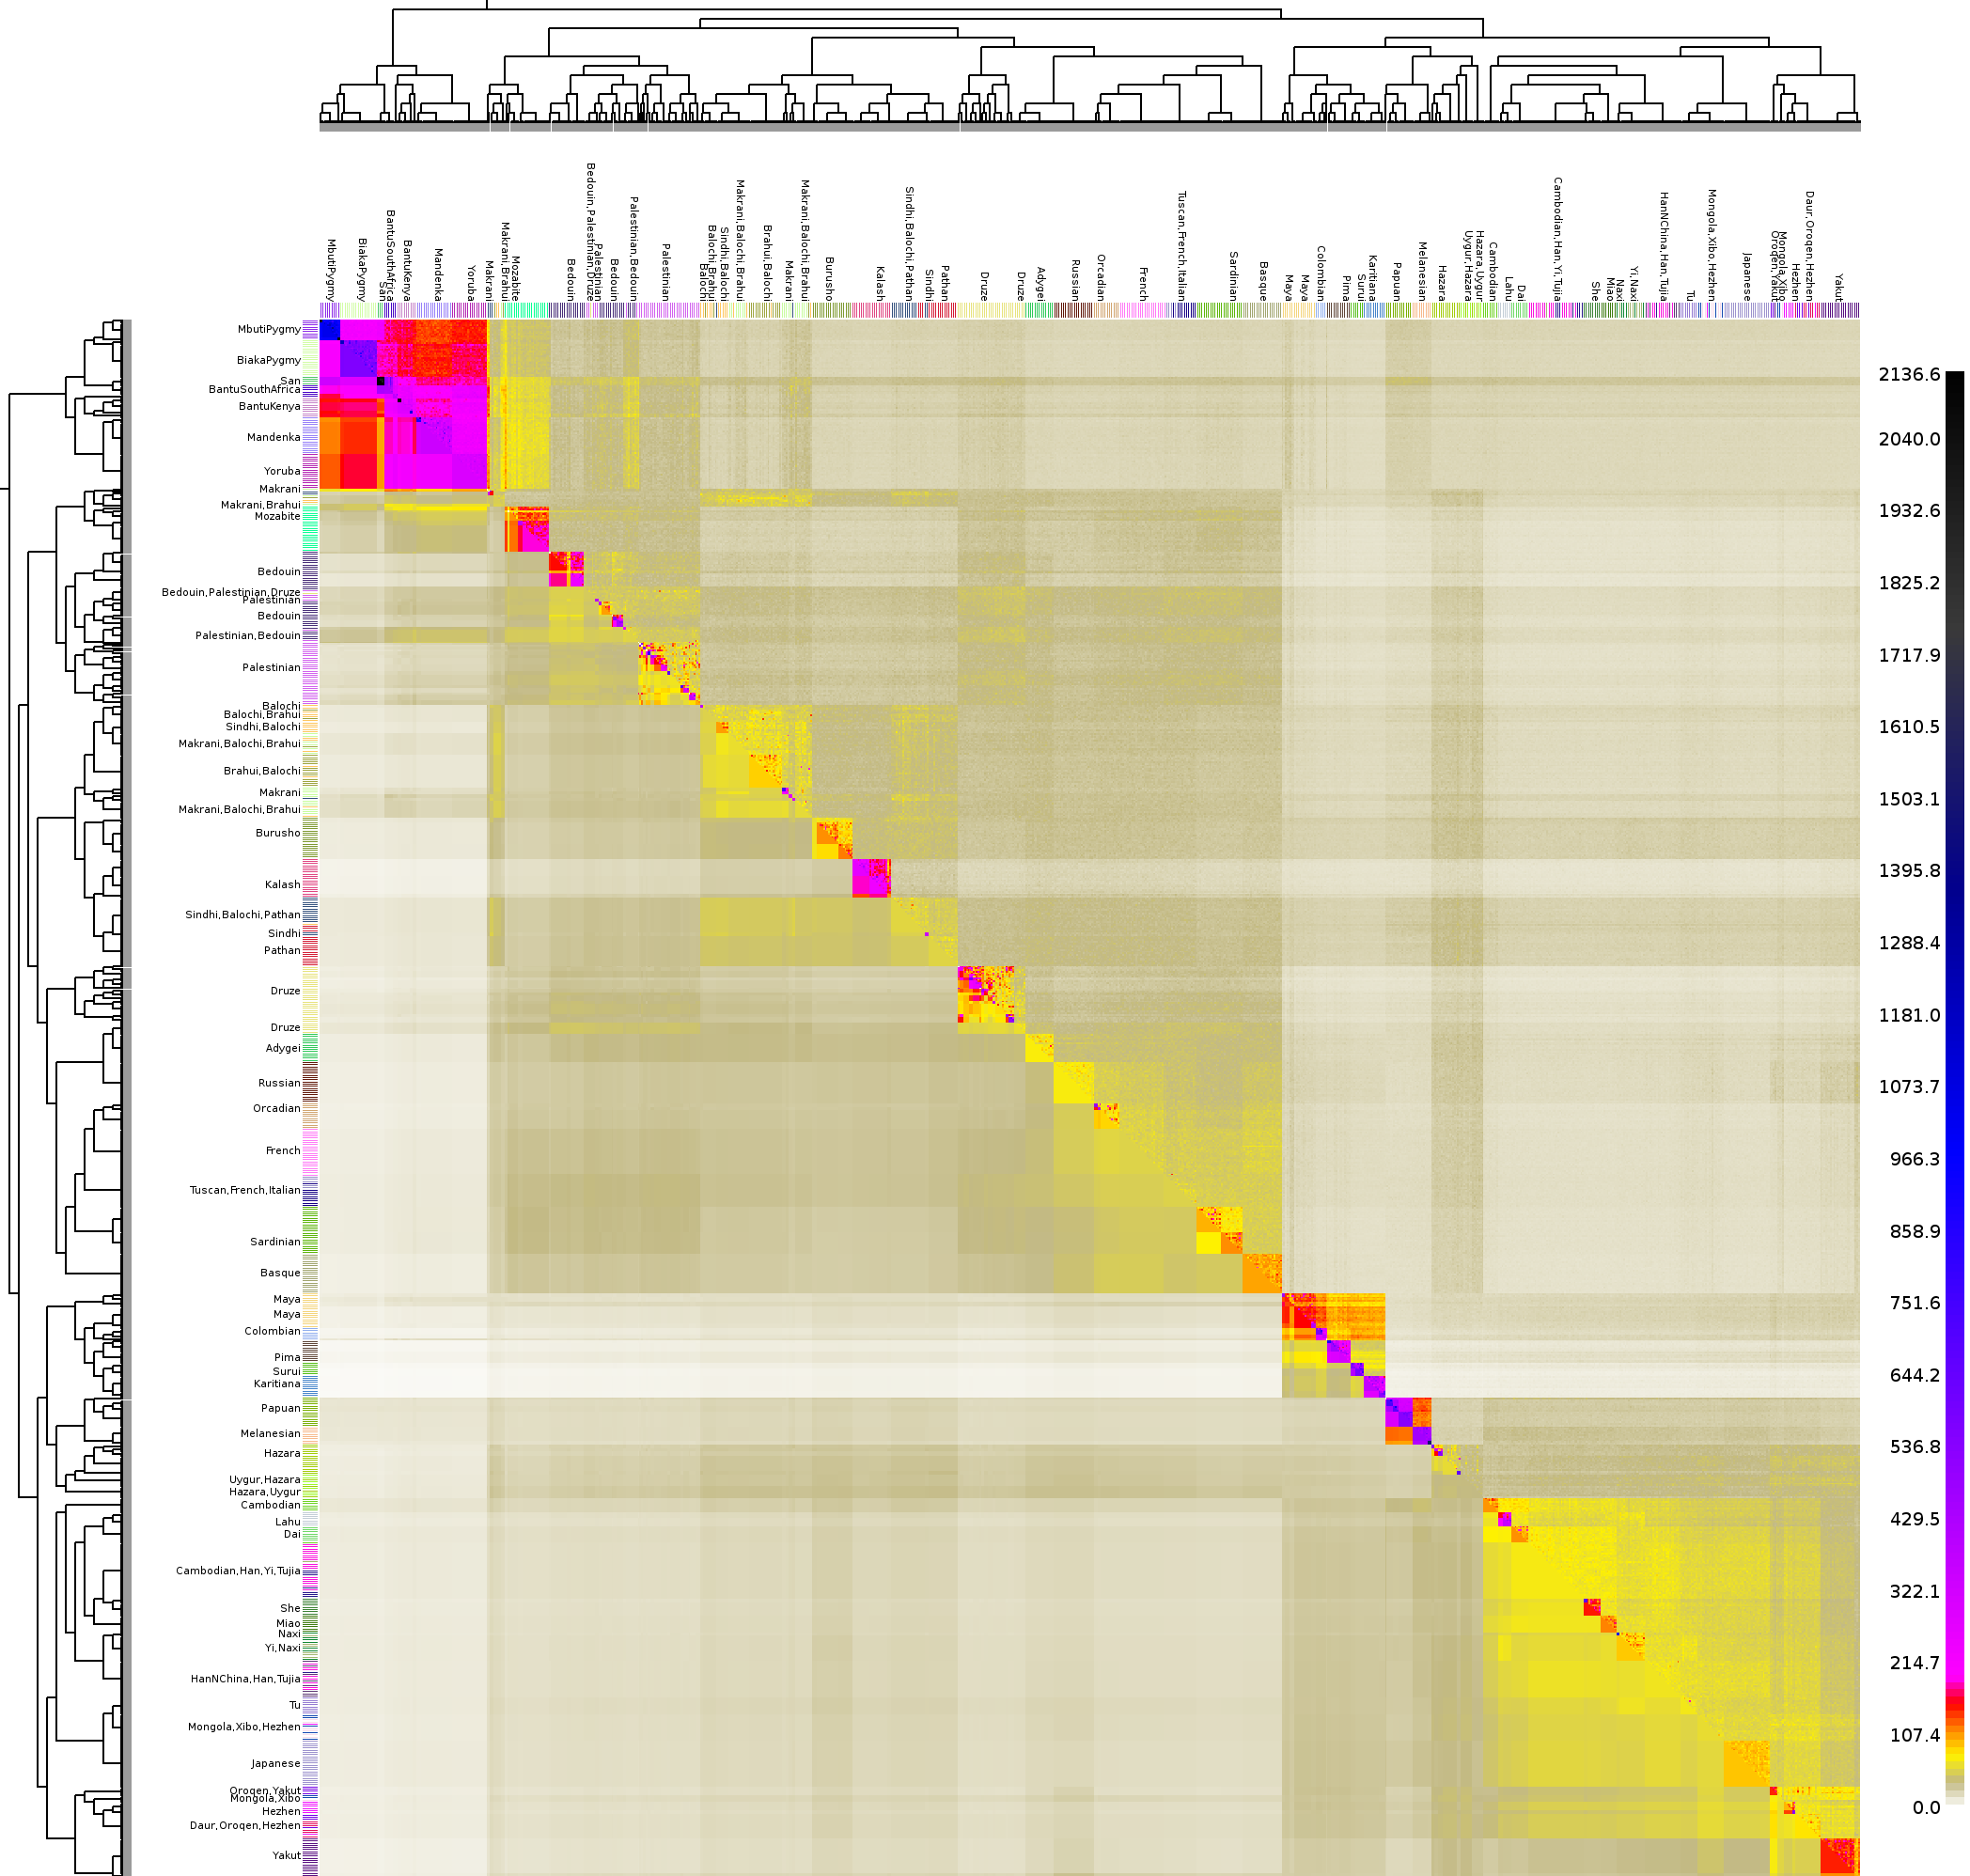
- What do I do if I'm interested in some individuals more than others? The best thing to do is still to use ChromoPainter to paint ALL INDIVIDUALS AGAINST ALL OTHERS. You should then construct a `finestructure force file' which will allow you to manually define populations within the `less interesting' indivduals. The individuals of interest can then be clustered by FineSTRUCTURE using the information about differential rates of ancestry sharing with these populations, usually leading to increased power relative to either running the whole sample simultaneuously or leaving out some individuals. The Manual explains the file format, whilst R users can check out the (documented) R scripts I used to generate the HGDP results. For reference, compare Figure 5 of the paper with the Whole World HGDP heatmap).
- What if my dataset is too big for MCMC? You can consider using the Greedy Optimisation in order to find the Maximum Aposteriori (MAP) state. On the EastAsia dataset, this provides an identical MAP state to the full MCMC in 10000 iterations and an adequate approximation after only 1000. (The usual warnings about local optima still apply!) See the Complex Example for details.
Installation problems
- Windows: missing DLLs. We tried to include all of the required DLLs but some might be missing. let me know if you have this problem, then try to find the required DLL from e.g. www.dll-files.com.
- Linux: cannot install without superuser permissions. You have successfully run "./configure" and "make" but cannot run "make install" as you are not an administrator. Our advice is to NOT run "make install", but instead copy the program to somewhere in your path. I always add "$HOME/bin/" to my PATH variable using "export PATH="$PATH:$HOME/bin"". But we can't install it there by default as not all users will do this.
- Linux: missing libraries. If you cannot use the built-in system to install libraries (such as YaST or apt) because you do not have permissions, then the needed libraries can be installed locally. This can be tricky, particularly for wx-widgets. GSL is the most likely issue you'll face, which I solved by:
# To compile GSL, I did:

tar -xzvf gsl-1.15.tar.gz

cd gsl-1.15

./configure --prefix=$HOME/bin/

make && make install

# To compile finestructure, I did:

tar -xzvf finestructure-0.0.2.tar.gz # Note: version number!

cd finestructure-0.0.2

export GSL_CONFIG=$HOME/bin/bin/gsl-config

export LD_LIBRARY_PATH=$LD_LIBRARY_PATH:$HOME/bin/lib

./configure

make

# To run finestructure, I created a file "$HOME/bin/finestructure.sh" (below)

chmod +x $HOME/bin/finestructure.sh

# You can now run finestructure using "finestructure.sh".
finestructure.sh:
#!/bin/sh

export LD_LIBRARY_PATH=/usr/lib:/home/madjl/bin/lib

finestructure $@
let me know if you have this
problem and can't solve it.
- Linux: wxWidgets linking error. If you get an error when compiling
fineSTRUCTURE GUI that explicitly refers to including of wxWidget files, e.g.:
/usr/include/wx-2.8/wx/filename.h:393: error: ambiguous overload for

  `operator[]' in `wxFileName::GetPathSeparators(wxPathFormat)()[0u]'
then most likely the problem is that you have both 32 and 64 bit wxWidgets
installed. See this
discussion for a potential solution.
ChromoPainter
- Usage outside of fineSTRUCTURE. ChromoPainter is a very versatile tool and can be used for a wide range of things. If you need advice on its usage, then contact Garrett Hellenthal, who wrote the software. DL is a point of contact only for the GUI, which simply calls the command line version anyway.
- Linked model appears unlinked, or FineSTRUCTURE clustering appears nonsense. The EM algorithm chromopainter users to infer is greedy which means that it can get trapped in local optima. The Fix: try different "-n" values, e.g. "-n 1". This shouldn't be a problem when you use a good starting value of N_e (effective popultion size, -n option) and when your recombination map is in the correct units. However, if you have used makeuniformrecfile.pl this might not be true (it is calibrated to the SNP density in HGDP for humans). Try different "-n" values, probably much smaller than the chromopainter default, in the parameter estimation/EM step (e.g. "-n 1 -in -iM -i 10"). If you get a different Ne, this might be your problem. TO CHECK: Look at the ...samples.out file, and see if recombination is happening at every step. If so, you probably have been trapped in the "zero recombination" mode. (Note: you can "fix" this as a bug for C estimation by using a larger "-k" value, but then you still get effectively unlinked results.)
- How do I choose "-k" in the unlinked model?.
For the linked model, the default is fine. For the unlinked model: Rule of thumb: if you can
use an external program to estimate LD as decaying (say, by half) after l
SNPs, then you should use k=100l.
Double checking: If you use a value of "k" that is too small, you will
significantly underestimate "c". If you use a value of "k" that is too large,
then you will slightly overestimate "c" (due to lost statistical power). So,
make a plot of "k" vs "c" and choose the smallest value that it plateaus at.
Hint: the value of c inferred does
not depend strongly on the recipients you paint, nor on chromosome. So you
can take a SMALL SUBSAMPLE of your data (e.g. a Chromosome, and a couple of
individuals from each major population) and estimate "c" quickly (by running
ChromoPainter with "-a i i" for the few individuals, and estimating "c" by
using ChromoCombine). Hint: Finestructure inference does not depend
strongly on "c". If you are concerned, do the finestructure run with a
slightly larger "k" and only report features that are present in both
runs.This will be improved in the future
Chromocombine
- WARNING: Seen individual a total of times,... Not continuing with the possibly unbalanced input files. This means that chromocombine has not found all individuals the same number of times in the output files you provided. Either you missed some output files, or more likely you were running chromopainter on a cluster and some of the runs have been terminated/failed to run at all. Double check that all of your chromopainter output files have the correct number of rows: in "*.chunkcounts.out" there should be a header plus one row per individual. If any are missing you need to rerun the painting for the missing individuals.
- Header problems. There have been reports that under some conditions the chromocombine output file has an incorrect header, i.e. column names, but still has correct row names. I cannot yet recreate this bug. You can easily fix it by putting the column names in yourself, but please let me know exactly what you did to get the error so I can fix it.
finestructure
- Unlinked model produces nonsense, or no clustering. Did you use the "-k" flag? Try "-k 1000" or some other large number (that is at least 100x smaller than the number of SNPs you have). See the Complex Example for usage.
- Clustering is nonsense, or no clustering found. Did you run ChromoCombine? What value of "c" is estimated? (This could be an issue for the linked model too).
finestructure GUI
- The GUI is really slow with large numbers of individuals. There is a workaround when working with large numbers of individuals to make pretty pictures with the GUI. Firstly, uncheck the "Display" option, then load in your data, MCMC and XML files. You need a tree for this workaround. In the "View" menu, select "Aggregated (Alternative)" which changes the display mode to "population by population" rather than "individual by individual", which is less computationally costly to display. You can now check the "Display" option and set up the display as you want it; it will be responsive in this mode. Keep the "population scale" at 1 if you want to make sure that population labels appear as you configure them. (You cannot see individual labels nor see classification boxes in this mode, but you can still set them up). When you are finished, uncheck the "Display" option and select the view mode you desire. When you select "File->Export to Image" it will export the correct image without displaying it on screen; you should be able to achieve good results using this method.
- How do I assess convergence? This provides a visual assessment of convergence, not a statistical one. Firstly, do two identical runs with different seeds. (If you do not specify a seed, one is chosen at random). It is advisable to create a tree. Load the main dataset, XML file and tree. The stages are:
- Load the second dataset. Go to "file->manage second dataset", load the same data, the new MCMC file (and optionally the new tree file to go with this).
- Enable comparison in the pairwise coincidence model. First "view->pairwise coincidence", then "second view->enable alternative diagonal view", then "second view->use second dataset", and finally "second view->pairwise coincidence". This should display the MCMC sample for the first run on the bottom left and the second run on the top right. You should find that the differences between the two runs are hard to spot, and are of the scale of sampling variance, e.g. a few percent. (Note that a very similar procedure allows you to compare different features across the diagonal).
- With very large display sizes the labels do not display. When working with very large graphical display sizes (say over 2500 pixels in height) the display sometimes fails to render labels. This is caused by a bug in wxWidgets and does not occur on all platforms. I can't easily fix it as the bug is not in my code. However, there are two options to work around it:
- Use a smaller display. Note that for journal publications e.g. PLoS Genetics, a size of 2500 pixels is the maximum you can submit anyway. If you can't make it look good in this size it will not look good on a standard page.
- For larger displays, e.g. posters, make sure you have both X and Y labels on and with equivalent space assigned to them (correcting for the space the scale will occupy). Edit the figure in a photo editing program, and copy the Y labels (which display correctly) into a new file, rotate them, and paste them into the space for the X labels. Although they might not line up perfectly you can achieve this manually. (You can delete the Y labels easily enough if you don't want them). The scale is unfortunately affected similarly, but you probably didn't want a scale all the way down a poster; perhaps try a 2500x2500 plot for the scale and copy this in to your figure as appropriate. In the worst case you can redraw the text for this.
- How do I get show posterior assignment probabilities on the tree? For now, you can't - you have to use the R scripts instead. This is due to the difficulty of correctly placing and formatting the labels. It will appear soon.
Problems with the linkage model
- All "zeroes" in regionchunkcounts.out files. This is caused by having too few chunks in an alignment block. Firstly, check that your effective population size is correct. Did you estimate it via E-M in chromopainter? (using "-in -i 10", see complex example) If so, are you sure that it has been averaged correctly?
chromocombine is failing to calculate "c" because the chromopainter runs have insufficient chunks to make an estimate of the empirical variance. Therefore there are no full regions and the regionchunkcounts and regionsquaredchunkcounts are empty.
The value of "-k" in ChromoPainter is simply the number of chunks used to estimate the variance. Hence using fewer (i.e. 10) may work. Using too few gives a poor estimate of the variance; in principle for the unlinked model this is very bad as the SNPs are correlated. However, for the linked model it should be OK since the chunks are supposed to be independent. (In practice this is not quite true). If you want to check your "k" is OK, try doubling/halving it and see how much "c" changes by. If it is not much then your "k" is large enough to estimate c with.
If you think that your Ne value is correct, then your number of chunks limits what can be done. There are three approaches:
- Split the data up differently; if you have artificially split the genome then use larger blocks.
- Try to find the biggest "k" that works. Try decreasing k until all your blocks have at least 1 region, then use the biggest k you can. If this passes the test above, you are OK.
- Treat each alignment block as a single chunk to calculate this variance. You can do this using the "-C" flag in chromocombine. (Note that this currently doesn't work well if the true recombination rate in each block is very different, because most of the variance in the between block assignment rates will come from variance in the recombination rates)
Note that all of these problems are related to calculating "c". If fineSTRUCTURE is insensitive to the differences, then it doesn't matter. You can try a range of "c" values manually to check this.
