
R functions/example for fineSTRUCTURE
Files:
The following files are for processing ChromoPainter/FineSTRUCTURE output using R, in a more flexible way than available in the GUI. They add two main features: a) tree MCMC scores, and b) displaying ChromoPainter copying probabilities. See "Using the library".
- FinestructureRcode.zip, containing R functions and an example R file walkthrough.
- FinestructureRexampledata.zip, containing the data (finestructure input/output files) used in the example.
- ChromoPainterExampleHGDPdata.zip, example data for examining the ChromoPainter output file in more detail.
- FinestructureRexampleresults.zip, the figures that should be produced by running the example.
The following files are for manipulating labels and continents in order to restrict attention to some populations of interest, or make standard PCA plots. They are not part of the library and should be seen as a guide for creating your own scripts to do this. See the manual for more details.
- ContinentAndLabelRscripts.zip, contains a script to generate a valid FineSTRUCTURE state where each label forms its own population, and a script to splot these populations into continents (as Figure 5 of the finestructure paper does).
- HGDPcontinentsExample.zip, containing the whole HGDP distance matrix as used by the above two scripts.
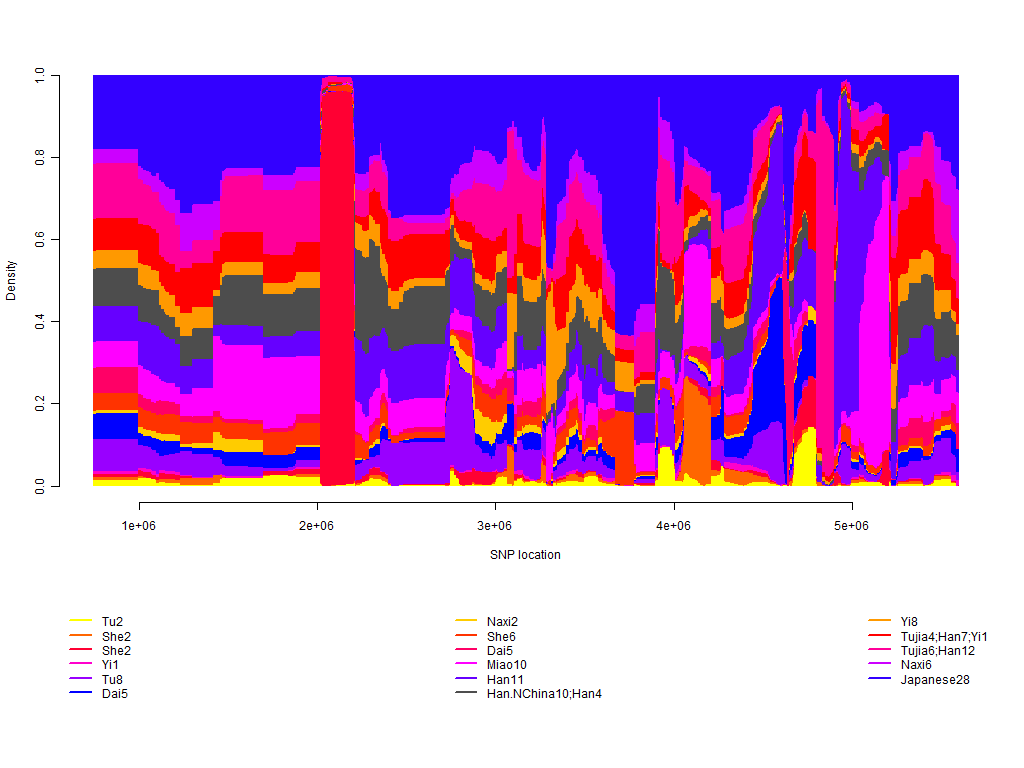
Example ChromoPainter output, for a Japanese individual from Chromosome 1 using the HGDP dataset:
Using the library
The R "library" is NOT A DEVELOPED TOOL. It is instead a moderately documented set of utility functions. For all but the most trivial use, you will need to do your own coding. I PROVIDE THESE WITH NO GUARANTEES WHATSOEVER - I hope that they will allow you to extract the finestructure xml into a familiar format, and set you up to create high-quality figures, but I take no responsibility for difficulties you have making it work!
That said, I'd like eventually to produce a more robust set of facilities, so if you make modifications that improve usage please let me know so that others can benefit. Whilst I attempt to help with problems, don't expect me to be able to solve any problems.
The best way to work is to have both the library file and your processing script open together, and use the documentation of the functions in the library. There is no other help. Some functions are poorly documented and this is probably because you don't need to use them in normal useage.
The key steps are:
- Creating a suitable dendrogram.
- Maintaining the correct ordering, with respect to this dendrogram. This can get tricky and the names are used primarily for this purpose.
- Plotting. You'll notice that there is a single function with most of the plotting functionaility, which can be adapted to a wide variety of needs. It makes sure a dendrogram matches the heatmap, and prints a suitable scale.
There is currently no support for continents in these files. I have code for this but it is even more clunky than the code here, and would take a lot of work on the users part to make it work. If you need to work with continents, contact me.
IMPORTANT NOTE
The dendrogram functions are not easy to work with. Particularly, there is some reliance on the ability to move between population labels, and individual labels, which assumes your labels are of the form
- ‹POPNAME›‹NUMBER›
e.g. Japanese7. If your data labels are not like this you will have problems. I'd recommend making a map between your individual names and some generic labelling, e.g. calling them IND1-N. I haven't implemented this!
For any queries, or for submitting updates, please contact DL at: dan.lawson@bristol.ac.uk.