WaveThresh
Help
mwd
Discrete multiple wavelet transform (decomposition).
DESCRIPTION
This function performs the discrete multiple wavelet transform (DMWT).
Using an adaption of
Mallat's pyramidal algorithm.
The DMWT gives vector wavelet coefficients.
USAGE
mwd(data, prefilter.type = "default", filter.type = "Geronimo",
        bc ="periodic", verbose = F)
REQUIRED ARGUMENTS
- data
- A vector containing the data you wish to decompose. The length of this
vector must be a power of 2 times the dimension of the DMWT (multiplicity of
wavelets).
OPTIONAL ARGUMENTS
- prefilter.type
- This chooses the method of preprocessing required. The arguments
will depend on filter.type, but "default" will always work.
- filter.type
- Specifies which multi wavelet filter to use, The options are
"Geronimo" (dimension 2) or
"Donovan3" (dimension 3). The latter
has not been tested fully and may contain bugs. See the
function mfilter.select for further details.
- bc
- specifies the boundary handling. If
bc=="periodic"
the default, then the function you decompose is assumed to be periodic
on its interval of definition, if bc=="symmetric"
then the function beyond its boundaries is assumed to
be a symmetric reflection of the function in the boundary.
- verbose
- Controls the printing of "informative" messages whilst the computations
progress.
Such messages are generally annoying so it is turned off by default.
VALUE
An object of class mwd.
SIDE EFFECTS
None
DETAILS
The code implements
Mallat's pyramid algorithm
adapted for multiple wavelets using Xia,
Geronimo, Hardin and Suter, 1996.
The method takes a data vector of length 2^J*M,
and preprocesses it.
This has two effects, firstly it puts the data into matrix form and
then filters it so that the DMWT can operate more efficiently
Most of the technical details are similar to the single wavelet transform
except for the matrix algebra considerations, and the prefiltering process.
See Downie and Silverman (1998)
for further details and how this transform can be used in a statistical
context.
RELEASE
Version 3.9.6 (Although Copyright Tim Downie 1996)
SEE ALSO
accessC.mwd,
accessD.mwd,
draw.mwd,
mfirst.last,
mfilter.select,
mwd object,
mwr,
plot.mwd,
print.mwd,
putC.mwd,
putD.mwd,
summary.mwd,
threshold.mwd,
wd,
wr.mwd.
EXAMPLES
#
# Generate some test data
#
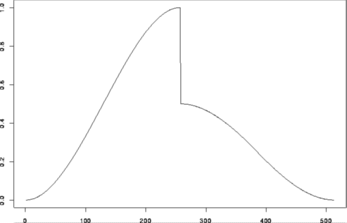
> test.data <- example.1()$y
> tsplot(test.data)
 #
# Decompose test.data with multiple wavelet transform and
# plot the wavelet coefficients
#
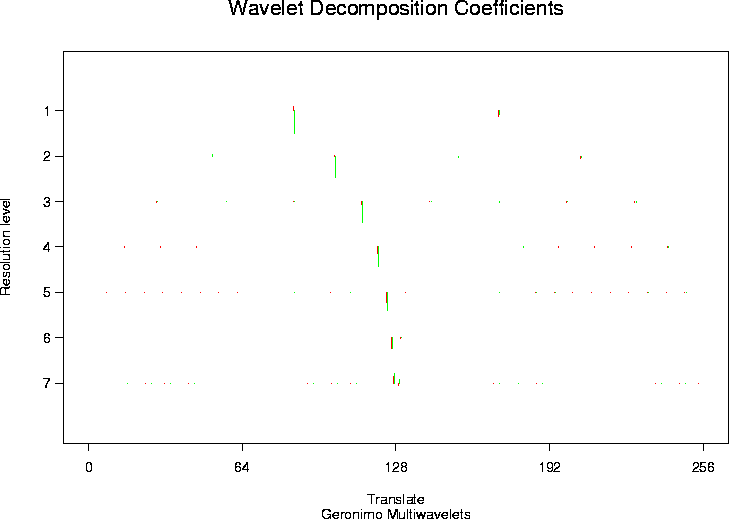
> tdmwd <- mwd(test.data)
> plot(tdmwd)
#
# Decompose test.data with multiple wavelet transform and
# plot the wavelet coefficients
#
> tdmwd <- mwd(test.data)
> plot(tdmwd)
 #[1] 1.851894 1.851894 1.851894 1.851894 1.851894 1.851894 1.851894
#
# You should see a plot with wavelet coefficients like in
# plot.wd but at each coefficient position
# there are two coefficients in two different colours one for each of
# the wavelets at that position.
#
# Note the scale for each level is returned by the function.
 #
# Decompose test.data with multiple wavelet transform and
# plot the wavelet coefficients
#
> tdmwd <- mwd(test.data)
> plot(tdmwd)
#
# Decompose test.data with multiple wavelet transform and
# plot the wavelet coefficients
#
> tdmwd <- mwd(test.data)
> plot(tdmwd)
 #[1] 1.851894 1.851894 1.851894 1.851894 1.851894 1.851894 1.851894
#
# You should see a plot with wavelet coefficients like in
# plot.wd but at each coefficient position
# there are two coefficients in two different colours one for each of
# the wavelets at that position.
#
# Note the scale for each level is returned by the function.